.svg)
Longshot Space is building a brand-new way of getting to space. It’s a kinetic launch system: a gun that accelerates a projectile payload toward orbit at hypersonic speed. Today, the test stands run the length of a football field but one day it’ll be close to a kilometer long. Firing a shot of payload takes mere milliseconds and almost everything that determines success or failure is observed in a fraction of a second.
During a shot gas is injected in stages, each timed to where the projectile sits in the barrel. The projectile is a barbell of two plates, and the gap between its two photogate dips gives its speed. The width and spacing of those dips is the heart of the analysis. If Longshot cannot see them, they cannot understand what the shot actually did.
Longshot Space is hiring people to help build the gun that reaches orbit. [See their open roles]
Keep the dashboards. Rebuild what's underneath.
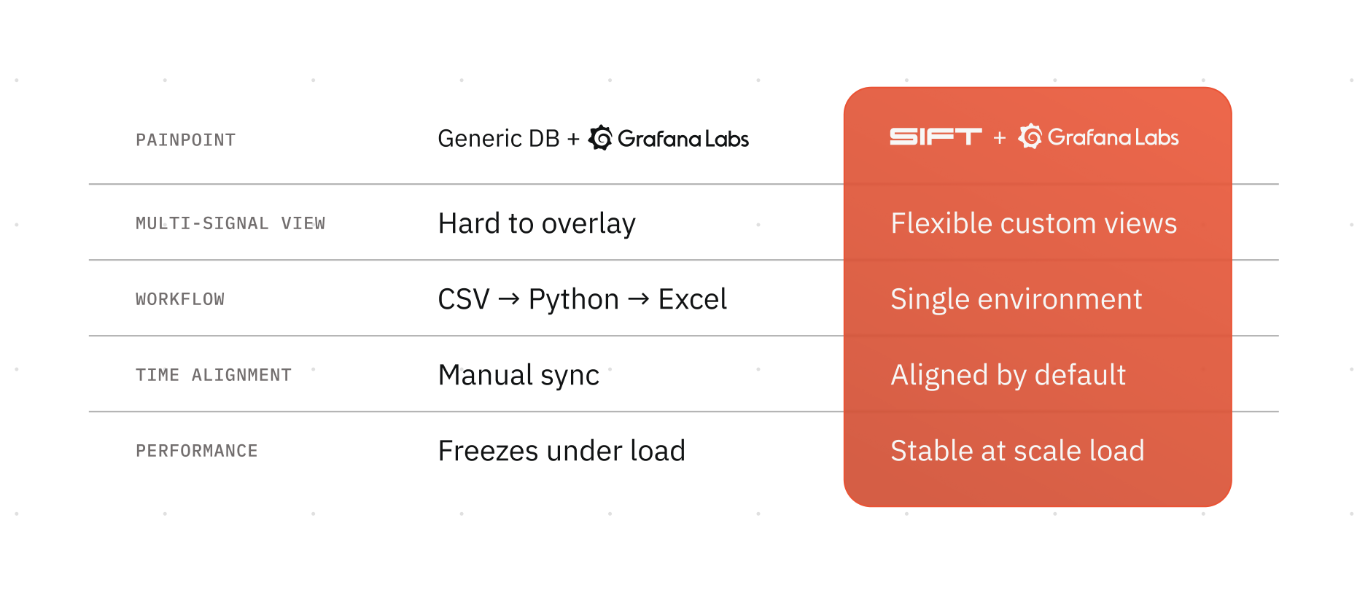
For a long time Longshot ran its own pipeline: a custom data acquisition system feeding InfluxDB, with Grafana for visualization and CSV exports pushed through Python and MATLAB. It was a capable setup, the kind a strong team uses while it builds its own hardware. But as the launch system matured, it became clear that a time-series database with a general-purpose visualization layer was not going to be able to keep up with sub-second precision or an ever-growing sensor count. Longshot realized that the dashboards were not the problem. The backend beneath them was.
The detail that decides a shot’s success or failure got averaged away before anyone could measure it, and during tests the team sometimes checked the raw database directly just to confirm data was still recording. The work that mattered then moved off the platform into scripts. Each engineer kept their own Python scripts to find the dips, their own spreadsheets, their own way of computing speed. The answers came, but they varied with whoever produced them. There was no single source of truth.
Two pressures turned a known limitation into a decision. The engineers who wrote the original tooling had moved on, concentrating that knowledge in one person. And the program is scaling from tens of sensors toward thousands across far longer systems, where a manual process that already costs hours would cost days of the whole team's time. To address this, Longshot chose to rebuild underneath the dashboards, not throw them out.
Scale the backend, keep what works
Sift replaces the stack beneath the dashboards rather than the dashboards themselves. Teams can keep the panels, alerts, and views they already trust and run them on the Sift Grafana plugin, with a backend built for high-rate, high-cardinality telemetry that holds load times to seconds even as channels, tests, and vehicles multiply.
There's no cutover risk with Sift. It runs in parallel with the current stack, so the same data lands in both pipelines and a team moves across when it's ready, not before. Longshot keeps the dashboards it relies on and changes only what sits underneath.
The capability that changed the call
"You can just zoom in and you can see it. There's the data. That's exactly what I was hoping to see when we do a shot."
[Alexander Stroud, Head of Engineering], Longshot Space
It works because Sift preserves the true highs and lows at every zoom level rather than smoothing them into one point, so spikes and brief transitions are never hidden. (release notes: per-channel Min/Max downsampling)
What Sift gets right on day one
The shift was not a single feature. It was the analysis the team cared about moving onto one platform, where everyone works the same way, while the dashboards they rely on for monitoring keep running on top.
Measurement happens on the chart. The metrics tools read min, max, mean, and median across any selected window, so dip width and the delay between events come from the data directly instead of an exported script. (Metrics Panel)
Review runs automatically. A rule checks a channel against an expression, including rolling-window logic, and the moment incoming data crosses it, Sift flags the timeline so the team can see, comment, and accept or fail. The same rule runs on every future test. (annotations in Explore)
Runs compare shot to shot. Tests overlay on a shared timeline, aligned by run start or a named event, and related runs are grouped into families with statistical baselines, so a new shot is measured against what normal looks like. (relative-time alignment, Families)
The work lives in one place. Data streams in through one client, gets plotted and run through calculated channels, and gets shared with a link that holds the exact view. When it needs to leave, it exports to CSV, Parquet, or WinPlot. (export)
Longshot operates under ITAR, and Sift is FedRAMP authorized and deployable in government cloud, on-premise, or air-gapped, so security is a checked box rather than a sticking point. (FedRAMP)
The lesson for any hardware test team
Teams that build their own tooling tend to learn the same thing the hard way. When it strains under scale, the dashboards are rarely the part that failed. The backend is. It cannot resolve the timescales that decide your test, cannot keep a year of history fast, and cannot hold up as the channel count climbs. Most teams outgrow their Grafana backend long before they outgrow Grafana. The fix is to scale what sits beneath the dashboards, and to do it before scaling into a problem you cannot script your way out of. (When Grafana dashboards stop being enough)
The gun is the machine. The record of how it behaves should be built with the same attention to detail.
Ready to upgrade your backend? Get a demo.