.svg)
In year one, Grafana handles everything
In the early days of a hardware startup, speed is everything. You need to see if your battery is charging, if your motor is spinning, or how your test stand is holding pressure. For most teams, Grafana is the logical choice. It’s the industry standard for visualization, it’s intuitive, and it starts at the unbeatable price of free. One of its greatest strengths is its simplicity. It was designed well for dashboards and to give you as much context as possible with a quick glance. This makes it valuable for operations and live monitoring.
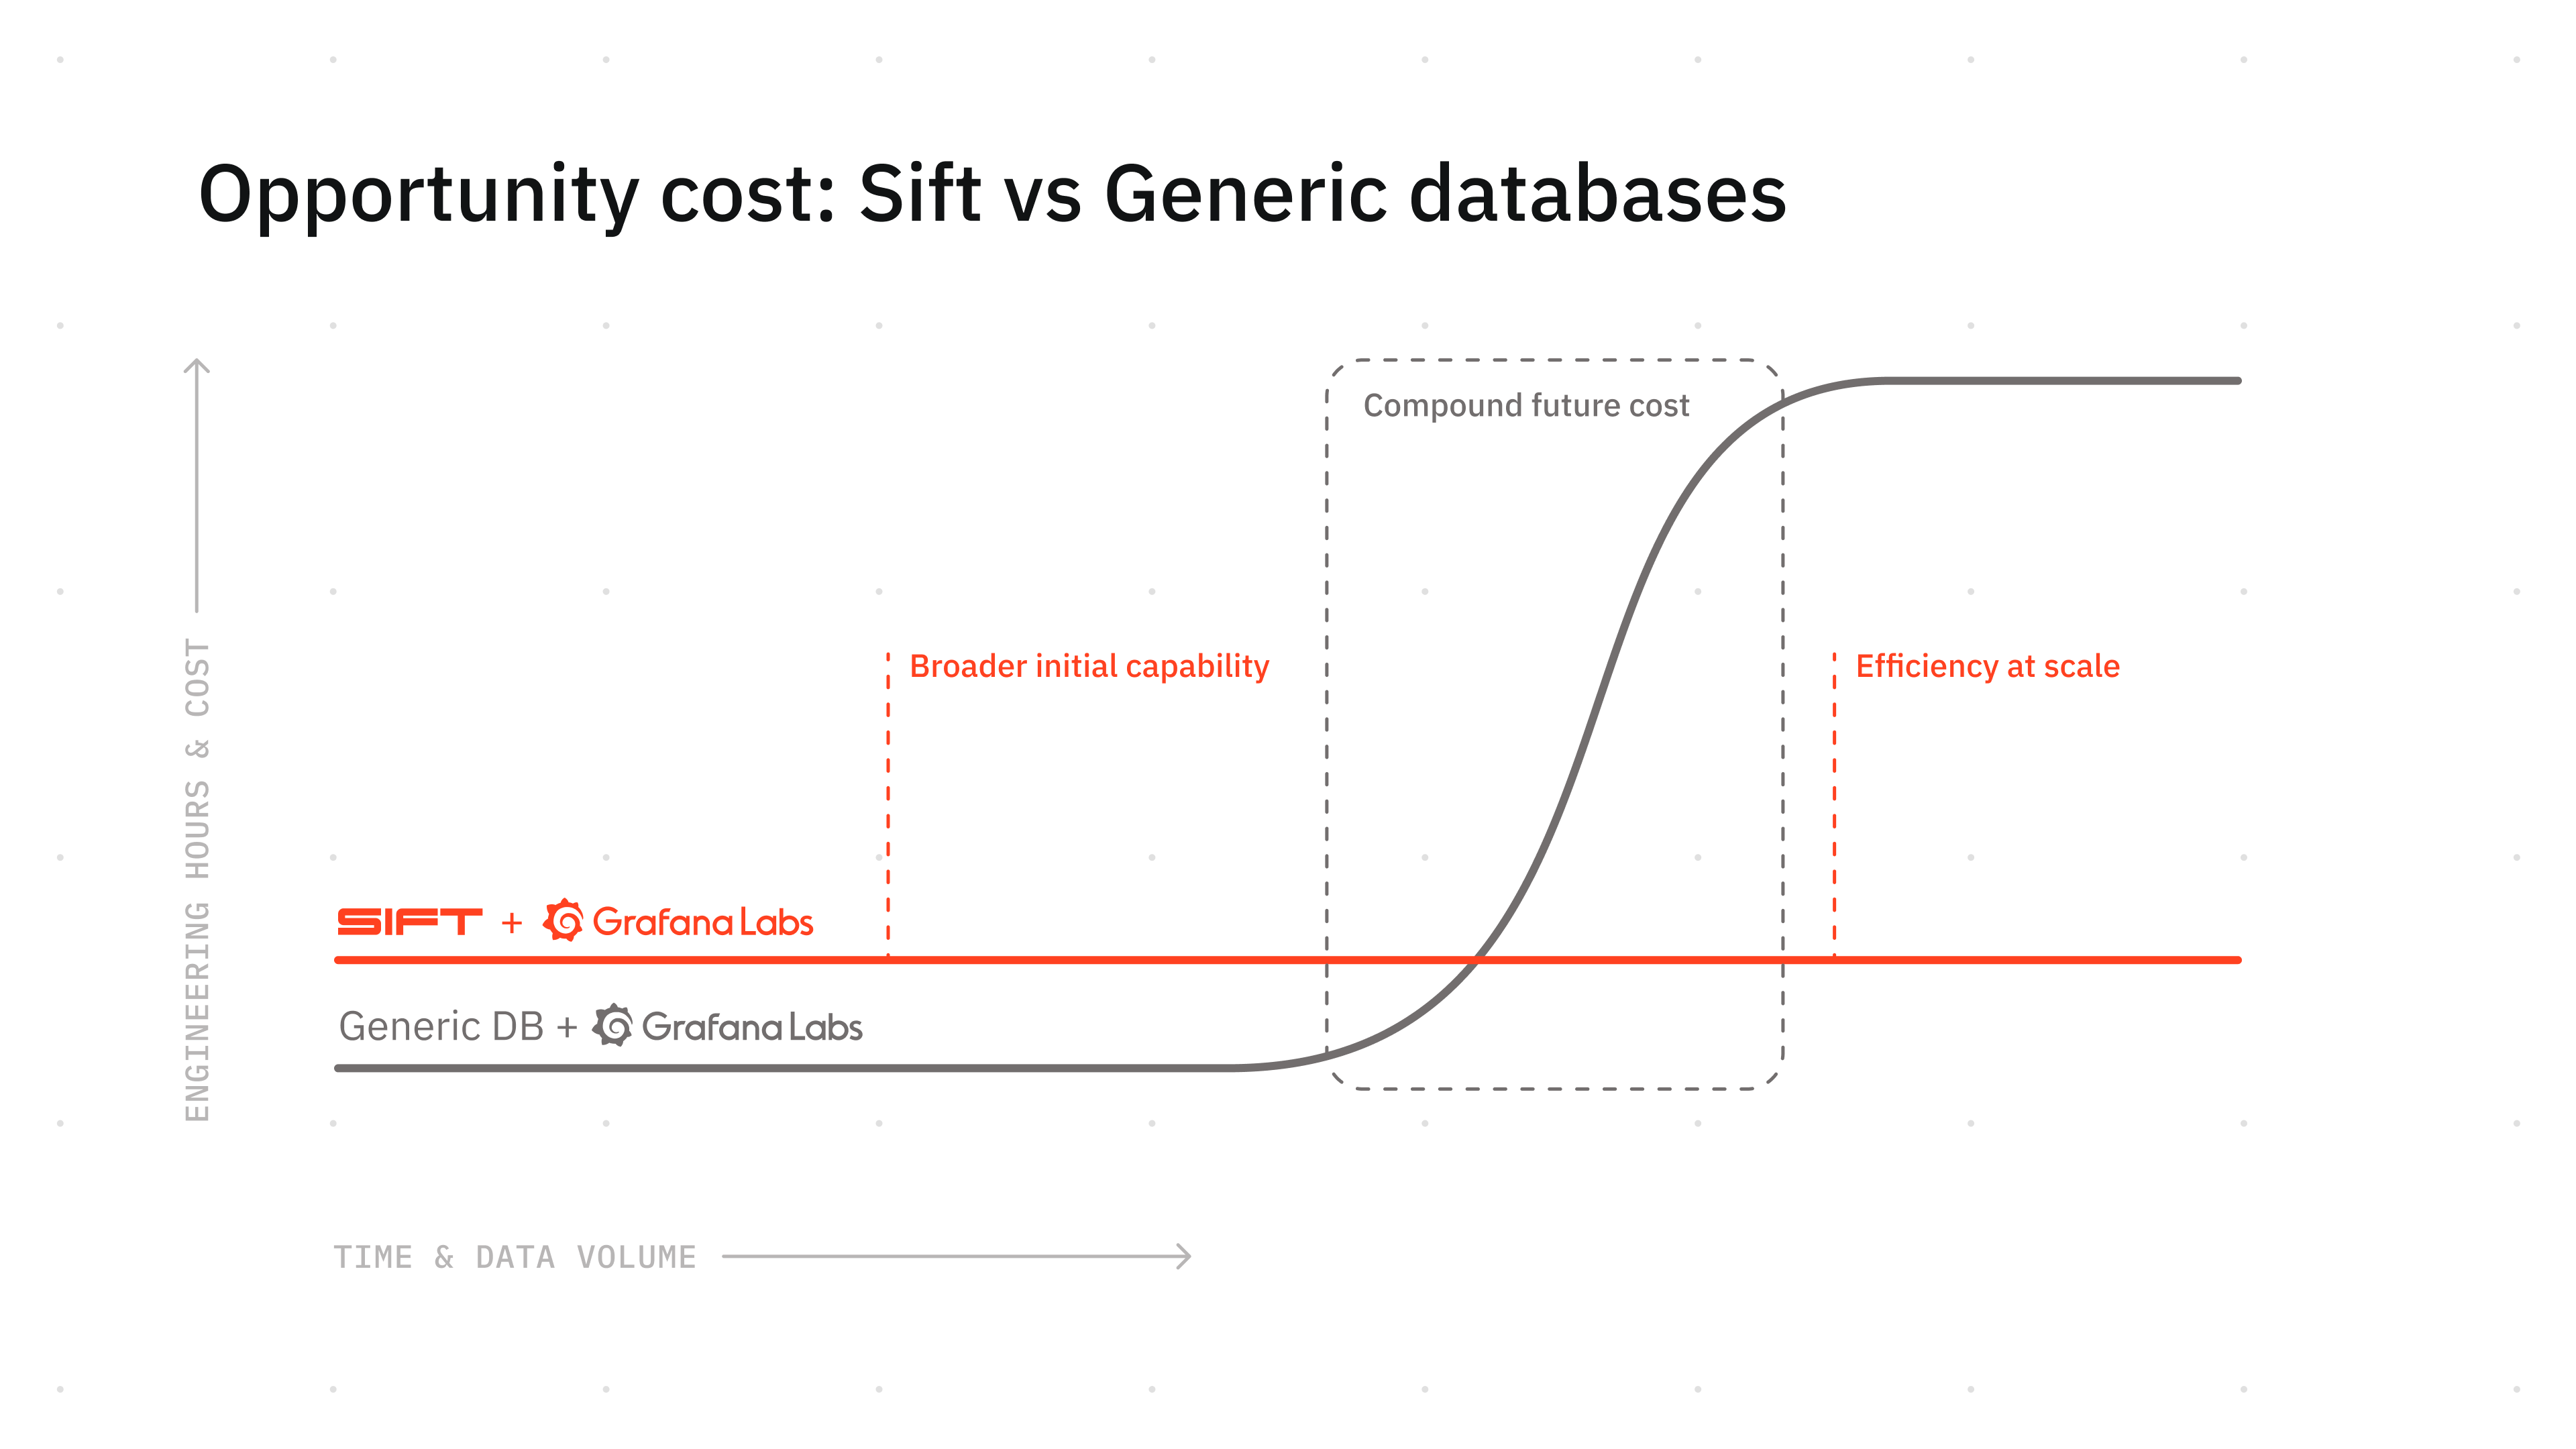
But, setting it up represents an opportunity cost
While Grafana itself is open-source, it is an empty vessel. Setting up a generic time-series database (TSDB) like InfluxDB or Prometheus for the backend is easy, especially early on. But all the time engineers spend on tuning the database is time they aren’t improving the prototype. As your data volumes grow, this engineering opportunity cost balloons. This includes:
- Maintenance: Managing load balancing, storage clusters, and data retention policies.
- Pipeline management: Handling high-frequency data ingestion without dropping points.
- Dashboard fatigue: As generic backends buckle under high-cardinality data, dashboards take 30+ seconds to load. For real-time use cases this can be fatal, because if the data can’t be seen in real time it may as well not be seen at all. Engineers might even stop looking at the data because the friction and time to load is too high.
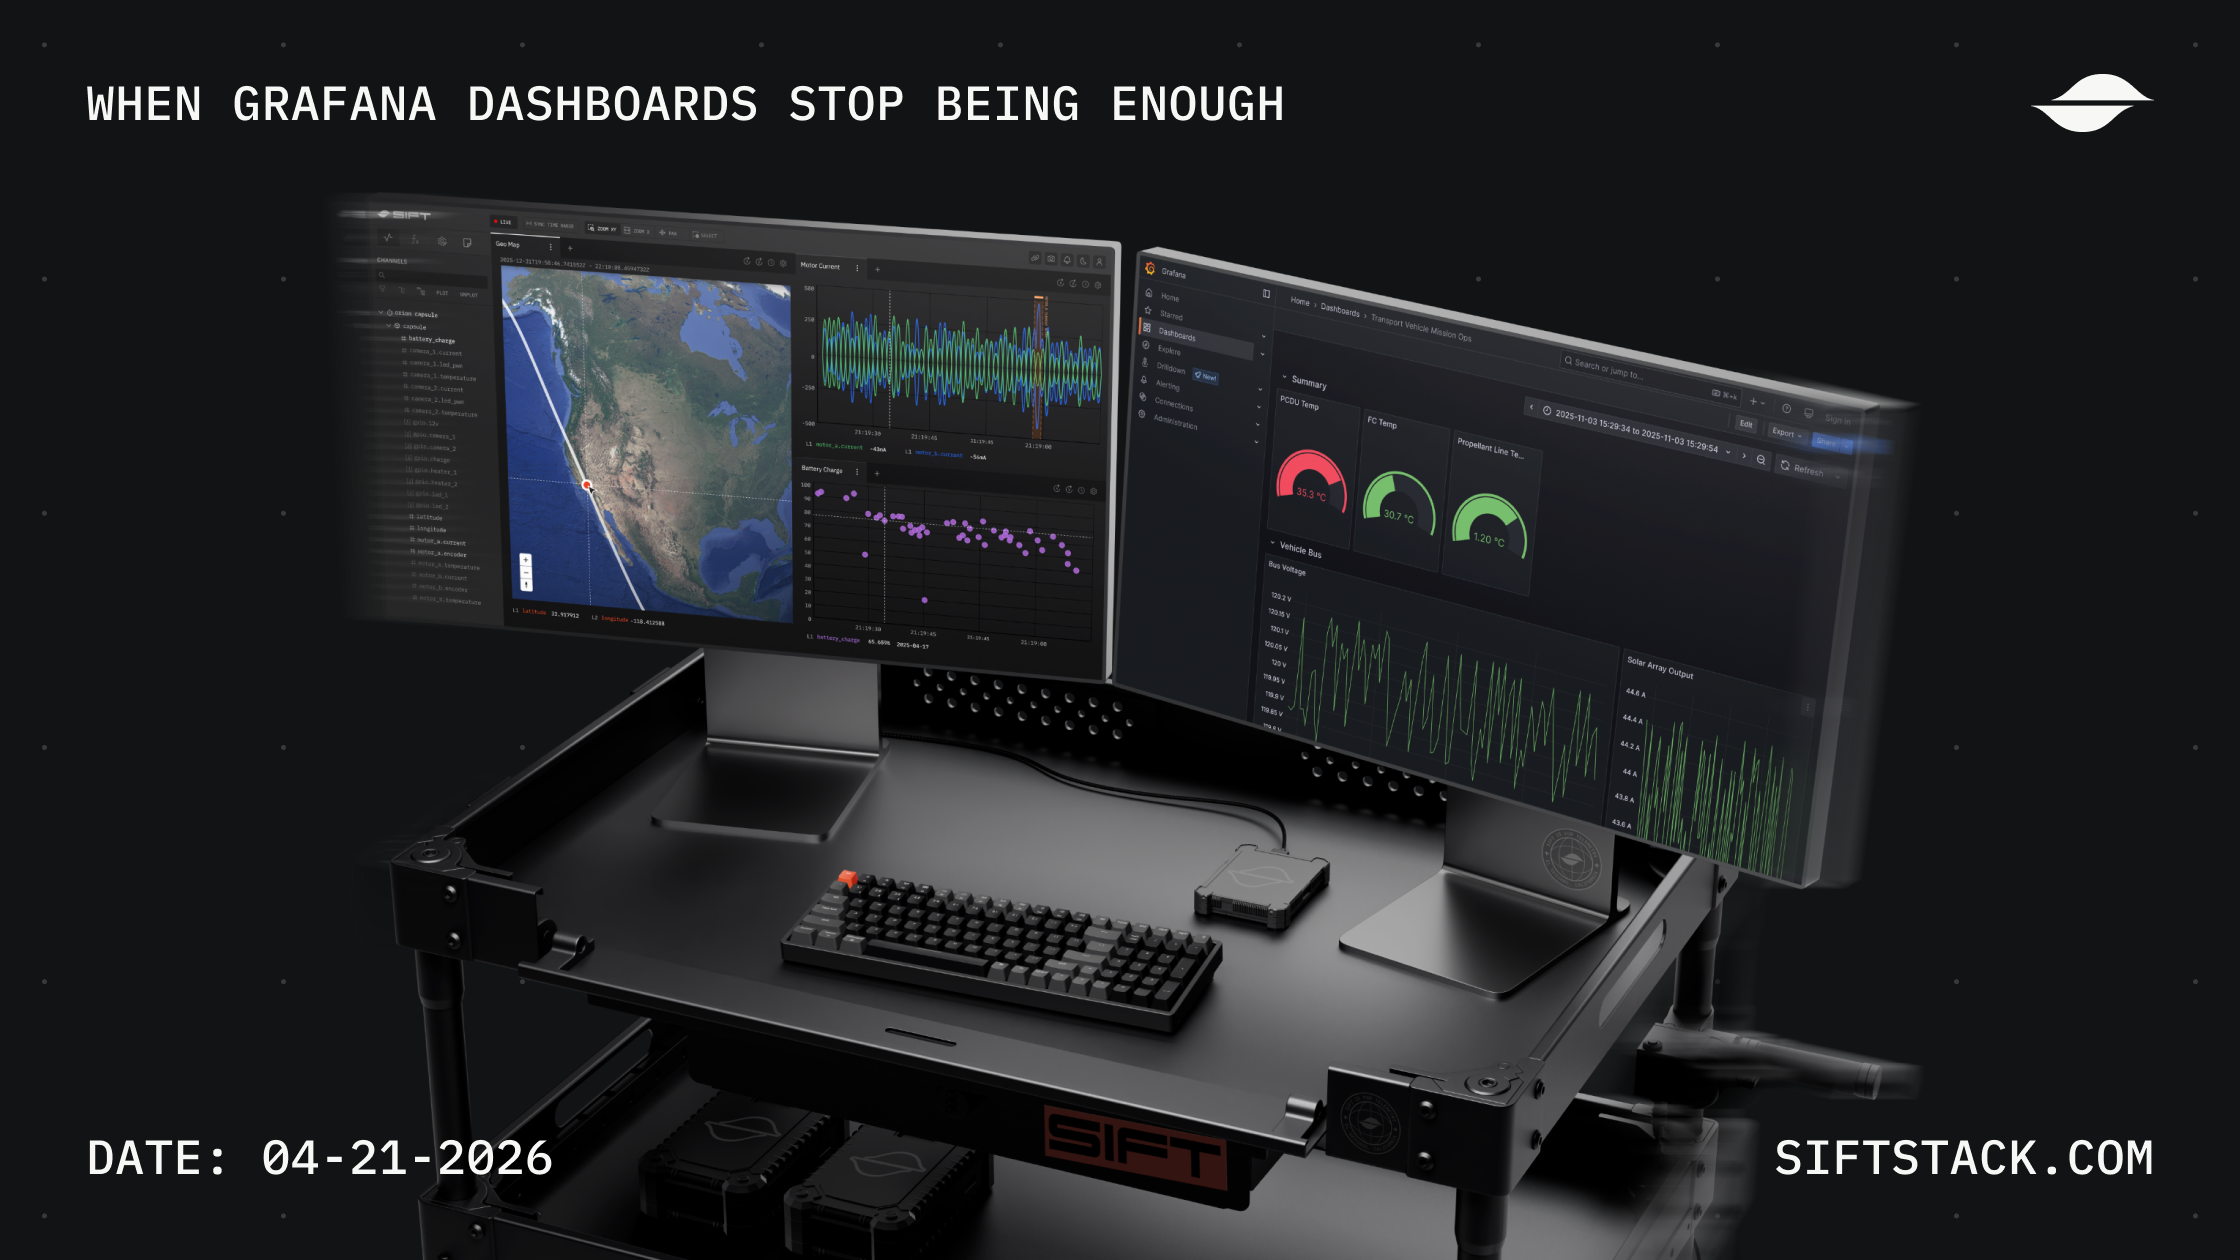
Grafana’s great for visualizing, but root causing anomalies can be painful
And as your hardware moves out of development and into the manufacturing and operations phase, you’ll need more than just a dashboard. It won’t be enough to just monitor the system on a regular basis (to use-case Grafana excels at, capped to a 5 second refresh rate). You’ll need to be able to observe the system and be able to answer the “why did this fail?” question in a timely manner. In short, you’ll need Root Cause Analysis (RCA) capabilities and will have outgrown a pure Grafana/Generic-DB stack.
In a standard setup, Grafana acts as a window into disparate databases. When this view is predefined and static, Grafana works well. But once you need to actually RCA an issue, recurring pain points make this difficult to accomplish in Grafana:
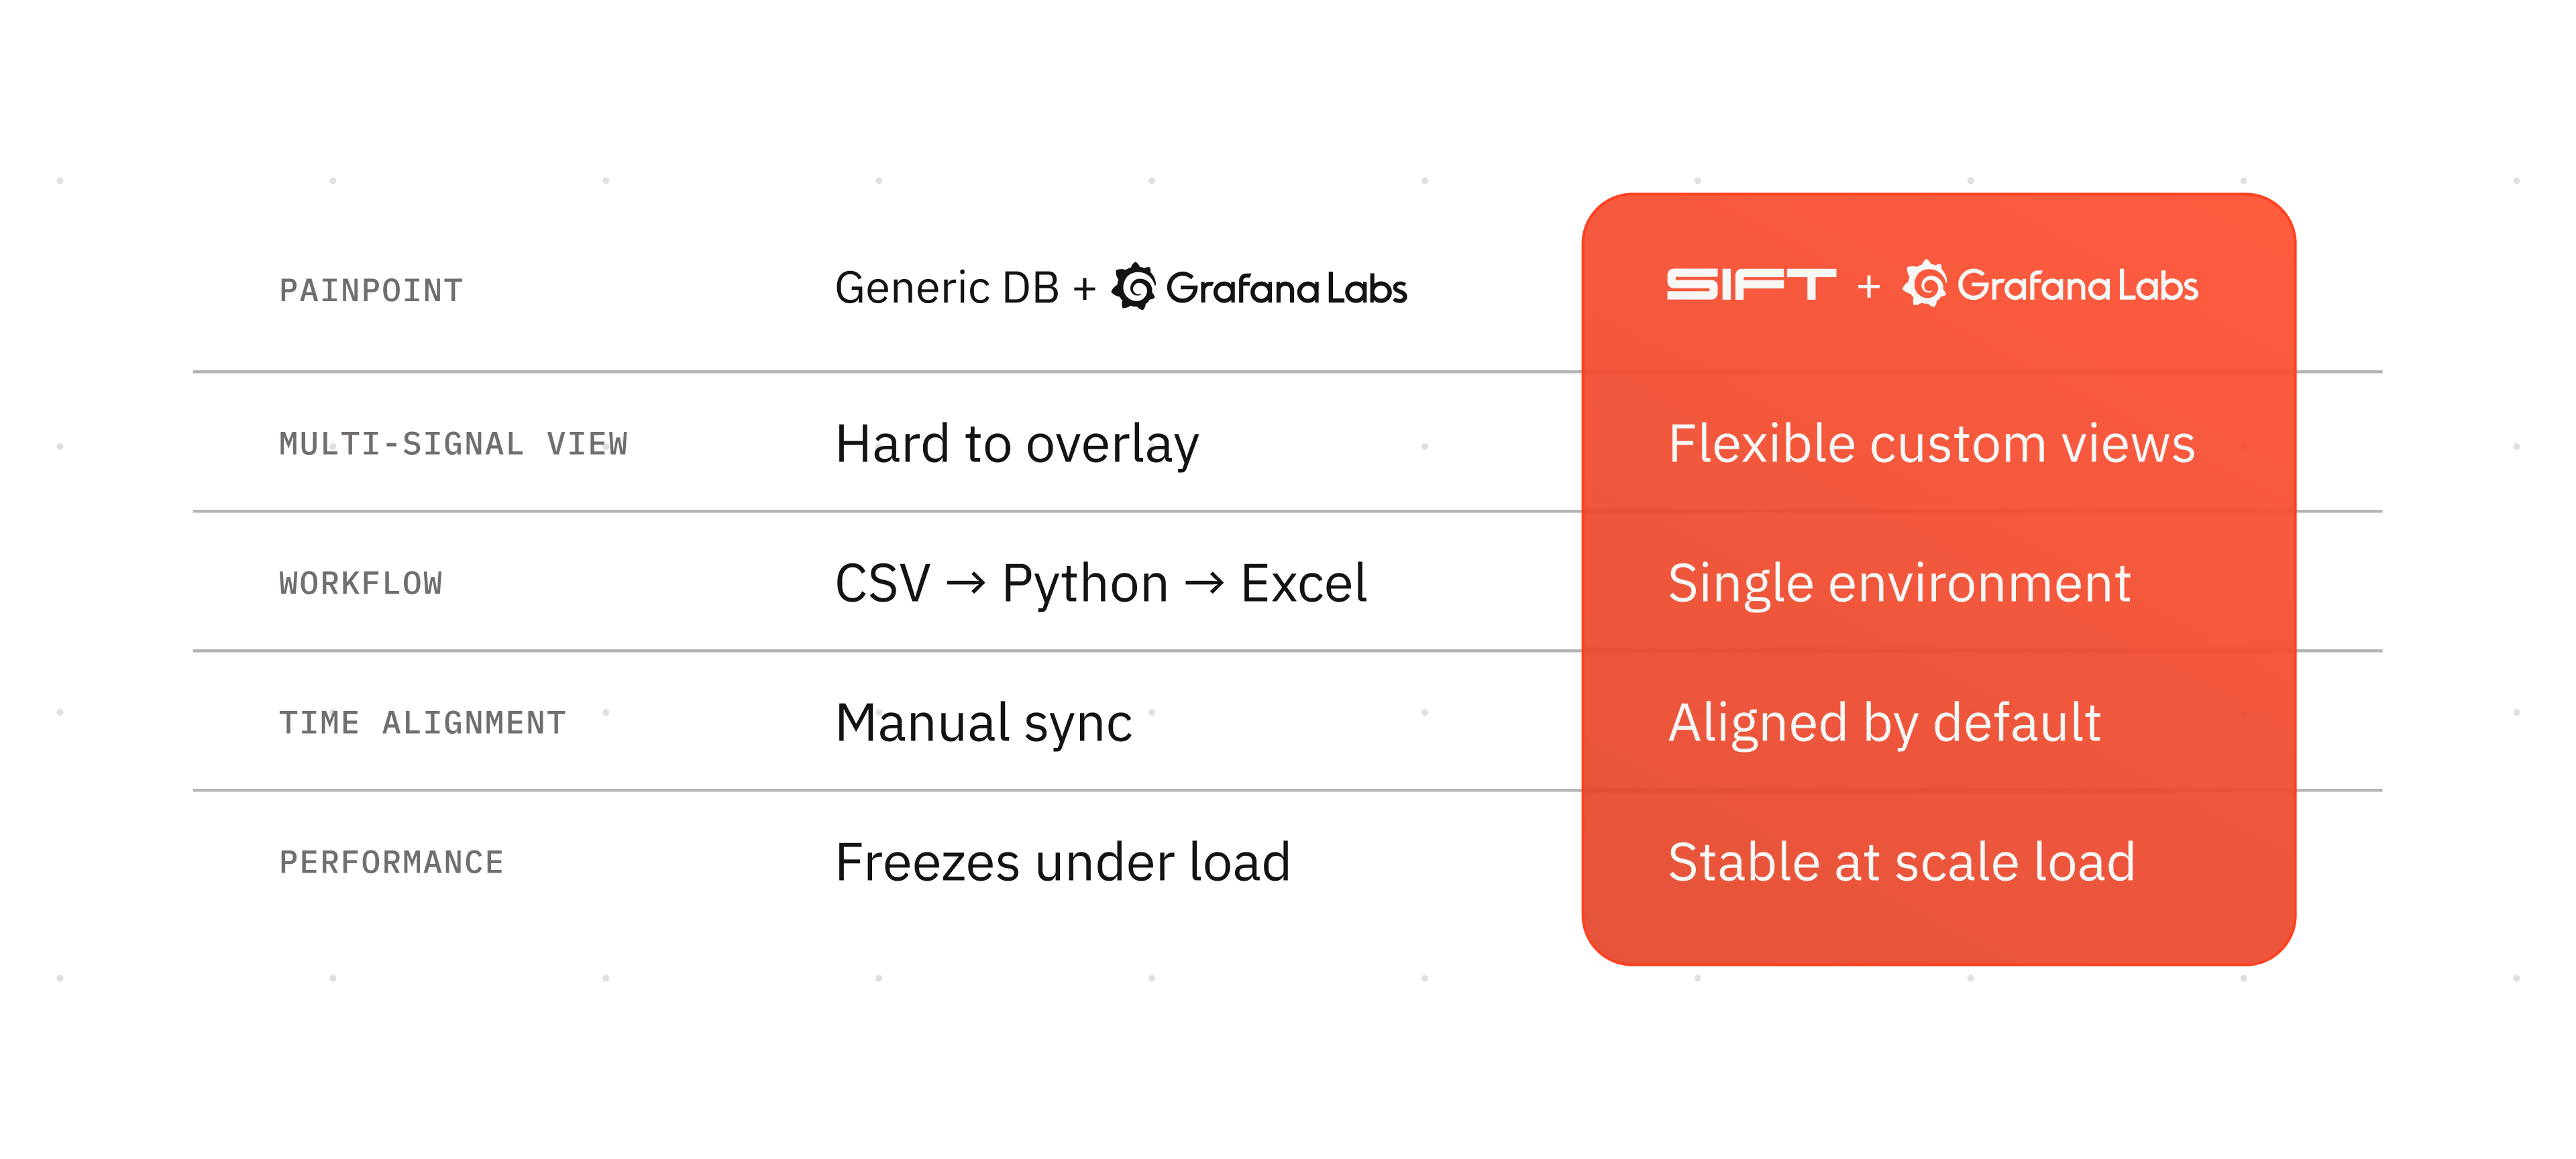
- Only one panel at a time: Grafana’s simplicity is great because dashboard panels give you a quick overview at a glance. But once you need to figure out why your pump is making rattling sounds, you need to dig into data to check sensors for flow rate and pressure at the same time. You could overlay this in Grafana, but it’s a pain and not well-supported. Instead, you might end up looking at just one graph at a time, losing big-picture context.
- Context switching: And what happens when you need to edit Grafana panels to dig even deeper? Grafana doesn’t support this well and you may need to leave Grafana entirely. You’re forced to export CSVs from multiple panels with a local Python script to pull into an Excel sheet to actually find the root cause.
- Manual time-alignment: An over-current event fires at 14:32:07. You check your telemetry timestamps, then open your software state logs in a separate window. The clocks are drifting by 200ms. Now you're manually aligning two timelines trying to figure out if the valve command caused the spike or followed it.
- Performance throttling: The moment you try to overlay many high-resolution sensors to find a correlation, the dashboard freezes.
Find the root cause in minutes, not weeks
Of course, these pain points and the need for more advanced analysis features does not displace the great UI and visualization elements that make Grafana such a well-adored tool. You shouldn’t have to choose between the UI you love and the performance your hardware demands. So to enable our customers to get the best of both worlds, we built the Sift Grafana Plugin. Sift gives you an enterprise-grade telemetry backend that scales with you, from your first prototype to a global fleet. Sift was purpose-built with features explicitly intended to address challenges with a Grafana/Generic-DB stack.
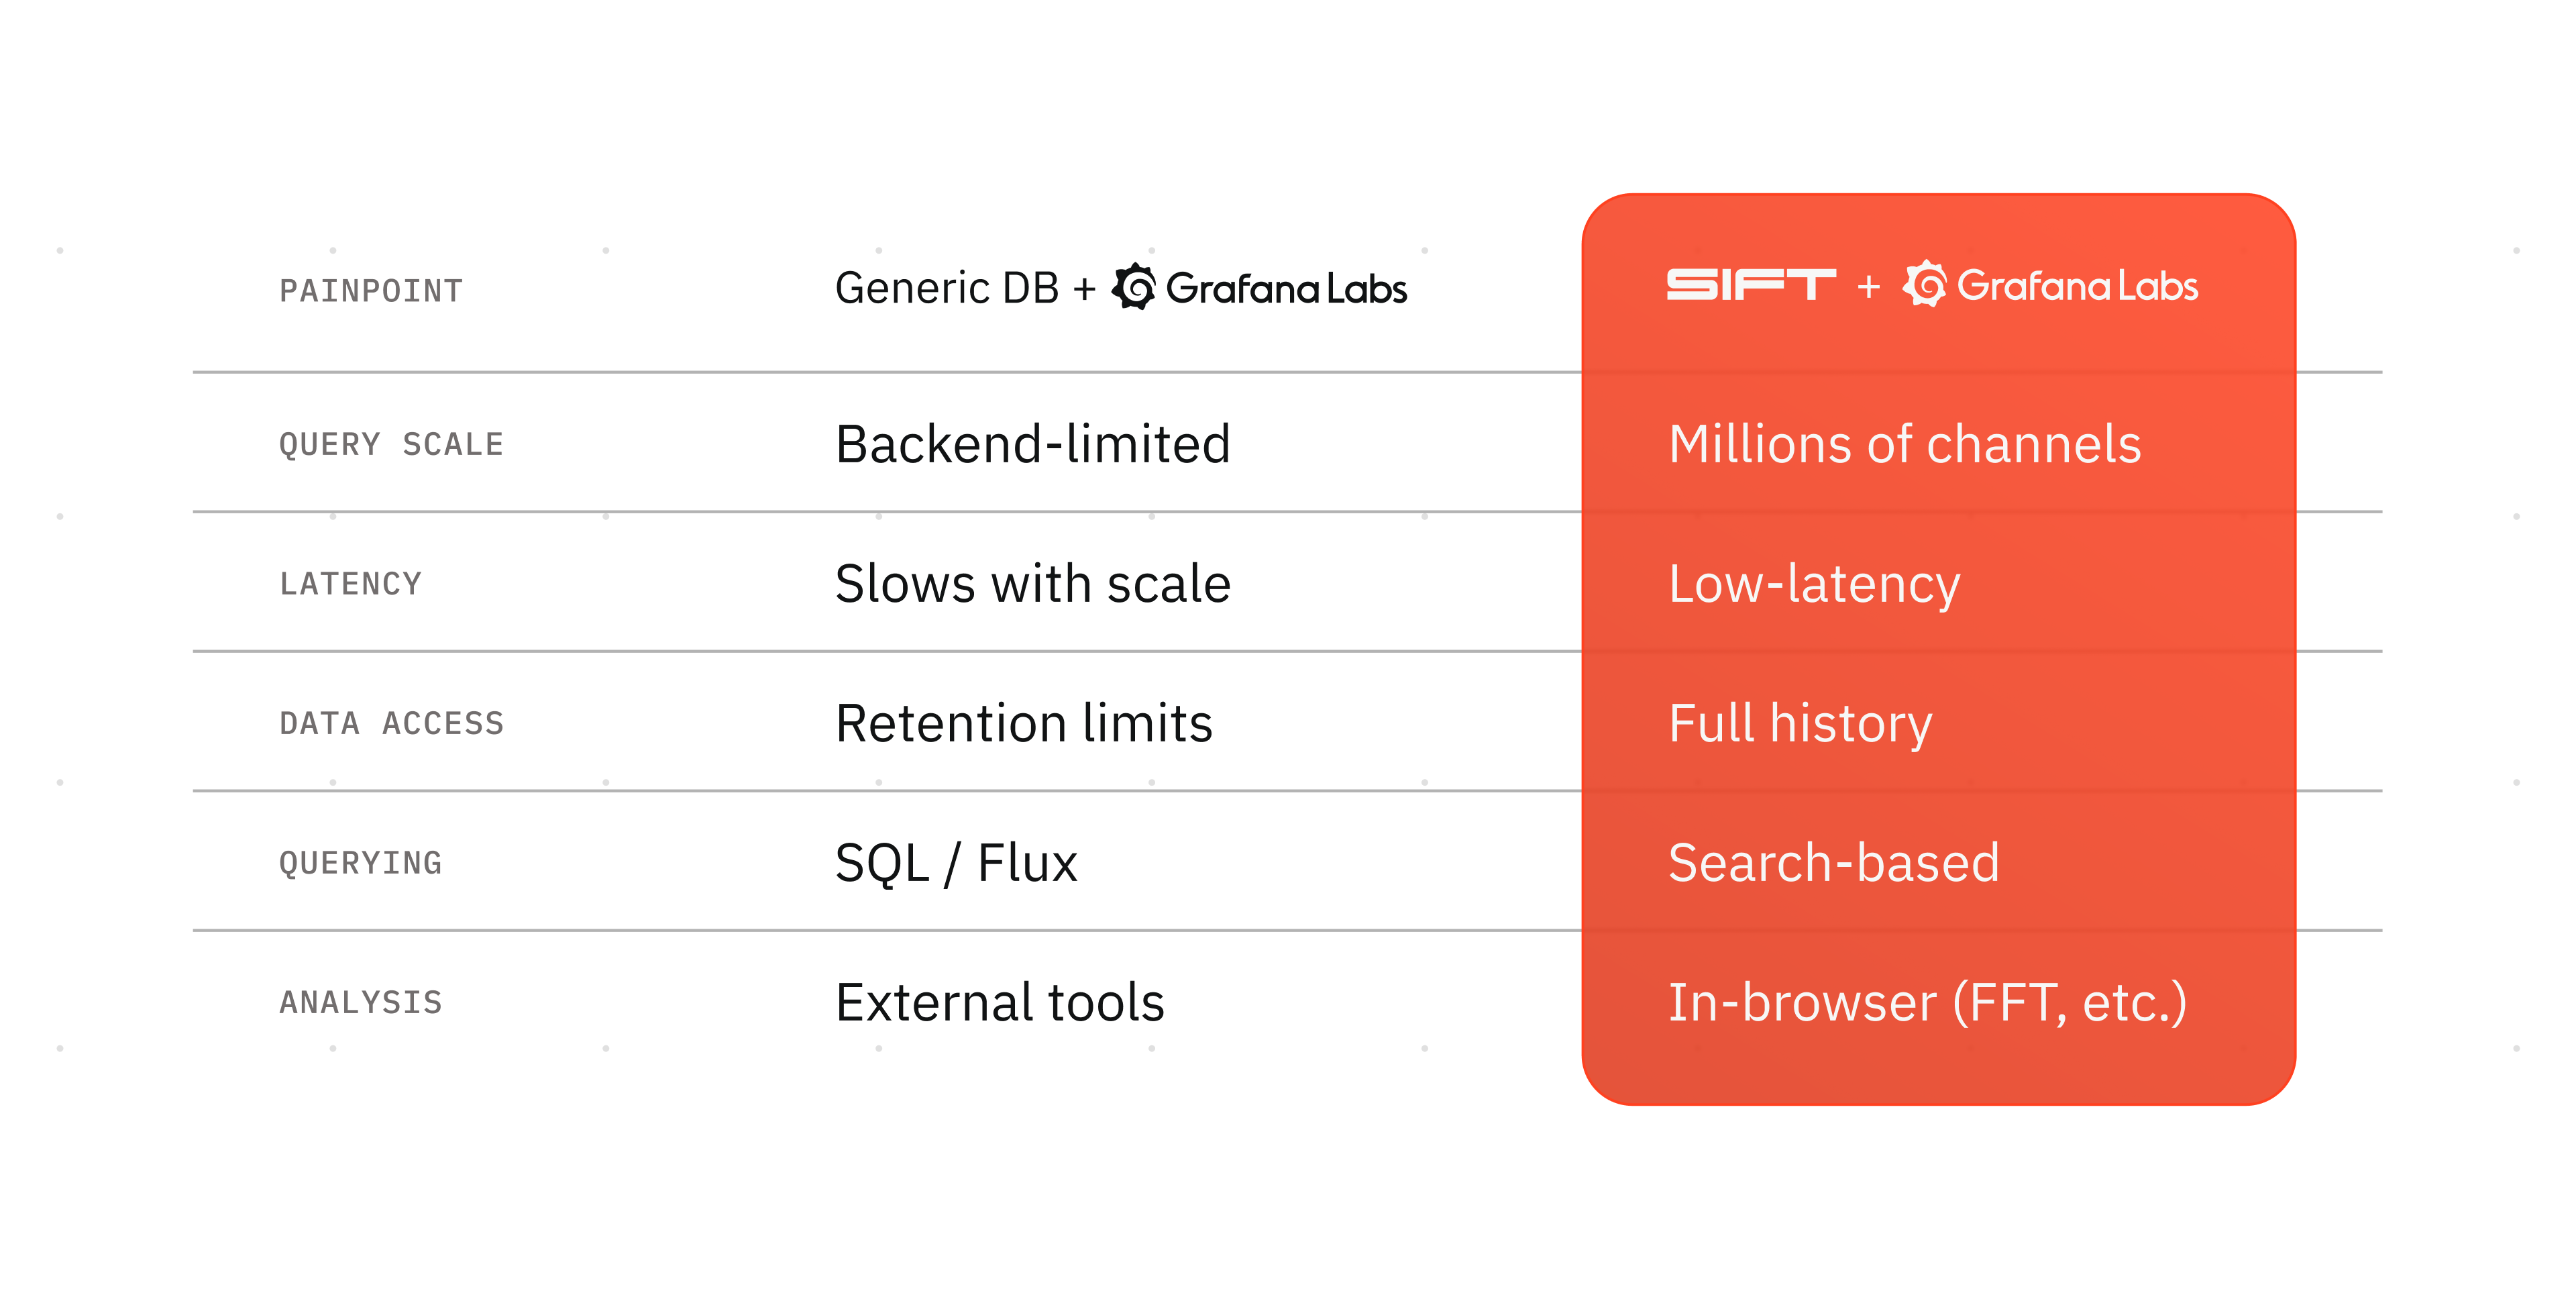
- Query millions of channels without crashing: Generic databases often buckle under high-cardinality hardware data, leading to memory crashes and total UI lockups when Grafana dashboards trigger dozens of simultaneous queries. While traditional backends struggle to index thousands of sensors or shove millions of raw data points into your browser, Sift’s architecture is purpose-built to handle millions of channels without breaking.
- Get the context you need at low-latency: Sift implements LTTB downsampling to ensure you lose only the minimum amount of information when downsampling while maintaining low-latency performance.
- See a full year of test data at the speed of today’s: Whether the pertinent test was conducted two days ago or two years ago, Sift keeps the information you need at your fingertips. No more worrying whether your test data’s retention expired.
- Search by part name, not SQL: You don’t need to know SQL or Flux to query schema in Sift. You can search by part name, subsystem, or test-stand ID. This allows non-software engineers to lead their own investigations without relying on someone else to make the information queryable for them.
- Run FFTs and derivatives without leaving the browser: Instead of exporting data to Python, Sift allows you to perform complex calculations (like derivatives, integrals, or FFTs) directly within the investigative view. You can see the rate of change of a thermal spike instantly, right next to the raw data.
Keep your dashboards, upgrade what's underneath
We aren't asking you to leave Grafana. We’re giving you the data platform that allows you to keep using it forever. By adopting Sift, you’re partnering with a platform that will be able to scale with you to turn data into insights at every stage of the hardware development lifecycle. Today, customers use Sift’s Grafana Plugin to get the best of both worlds. For example:
- Develop: As teams leverage Sift to tighten test loops, our Grafana plugin is used to monitor tests in real time.
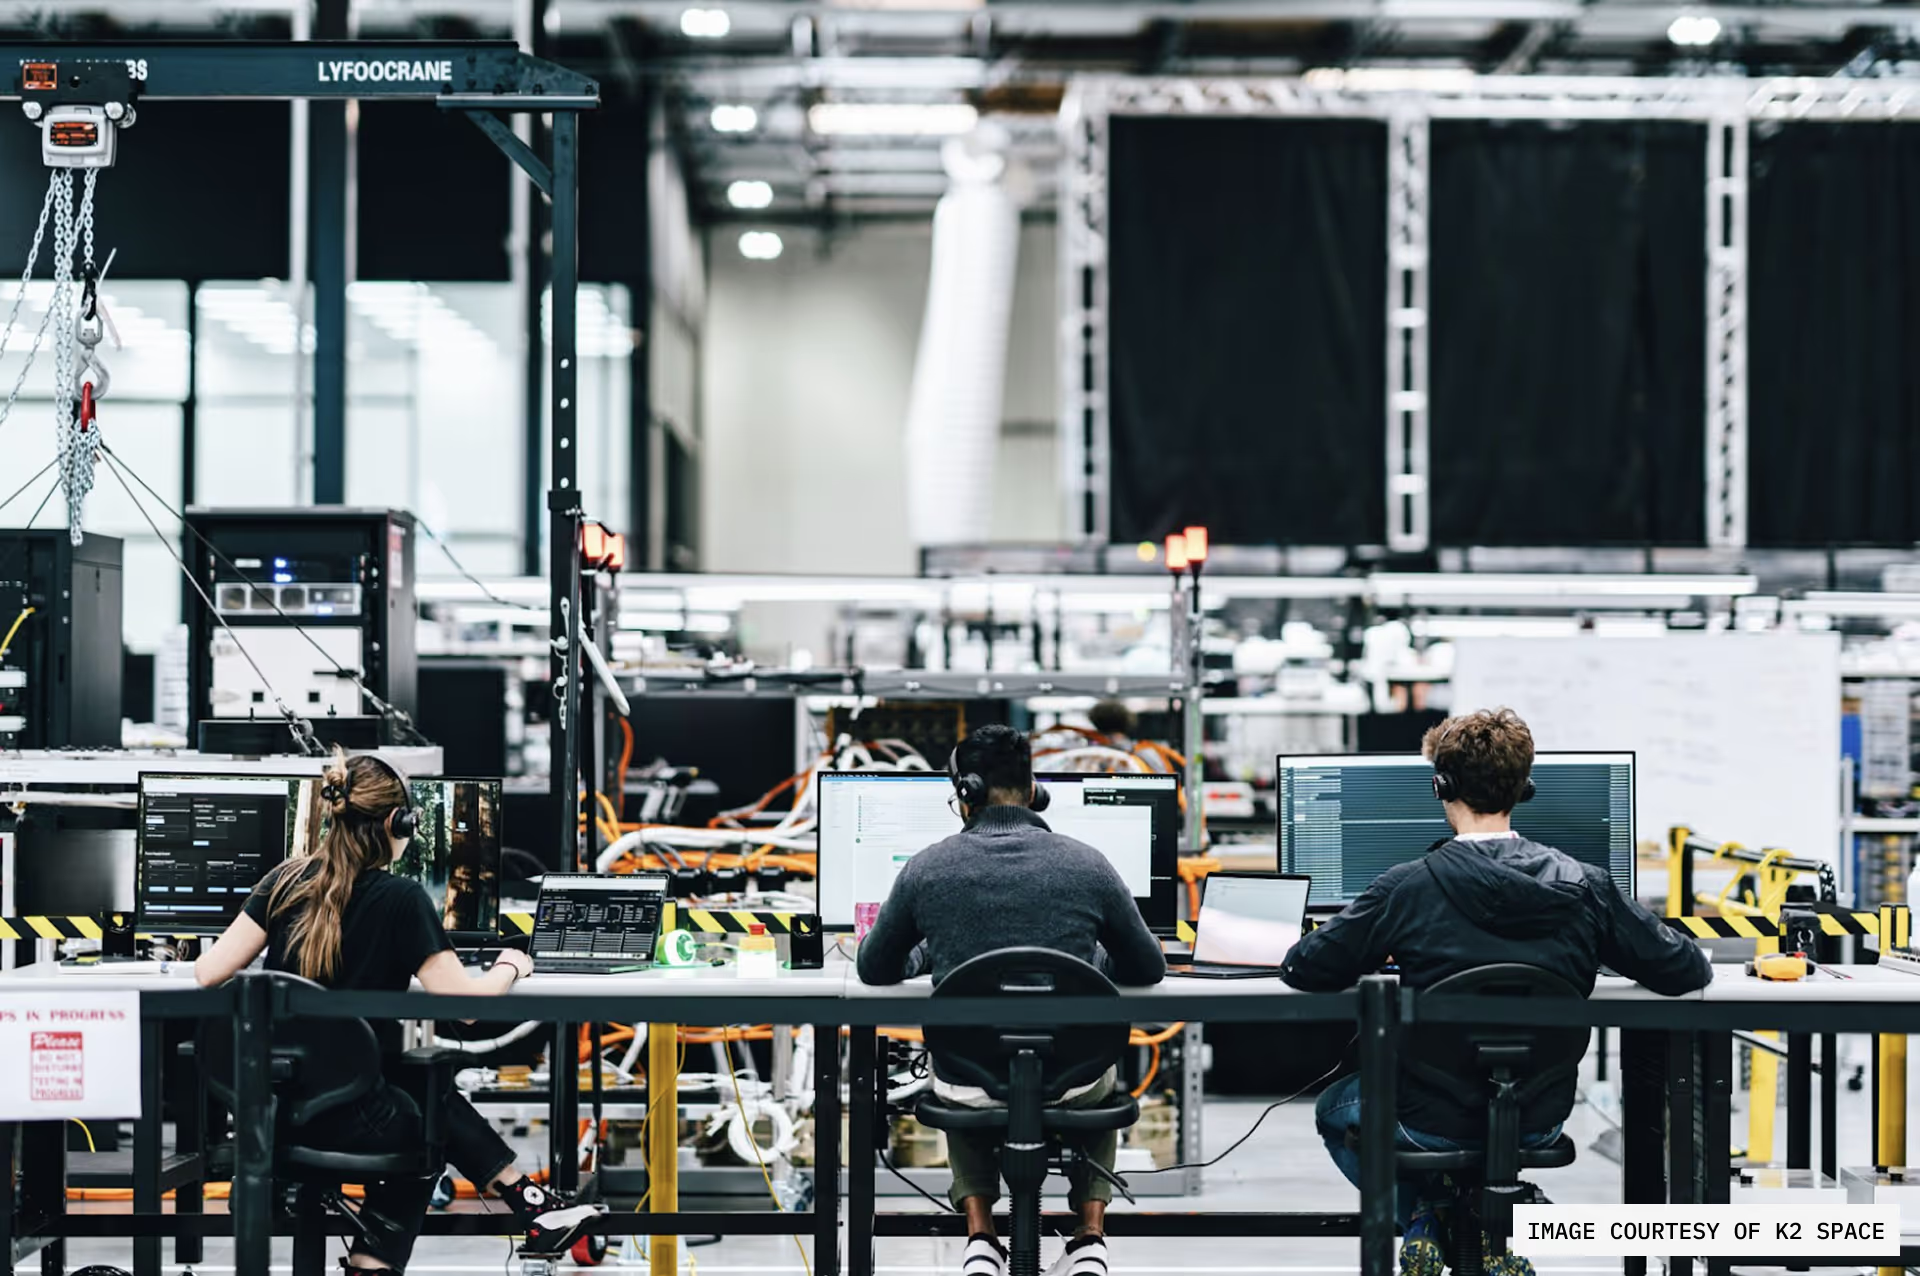
- Validate: As K2 Space is scaling its satellite production, Sift’s Grafana plugin is used to correlate what’s happening on the manufacturing floor to automated compliance reporting.
- Operate: As Astranis operates its satellite constellation in real time, it uses Sift and Grafana in their mission control.
Your data infrastructure should be an advantage, not a maintenance shift
The best time to solve a scaling problem is before it hits your production environment. By choosing Sift as your Grafana backend, you’re ensuring that your data infrastructure is a competitive advantage, not a maintenance burden.
If your Grafana dashboards are taking 30 seconds to load and your engineers are exporting CSVs to do root cause analysis, let's talk.


.avif)