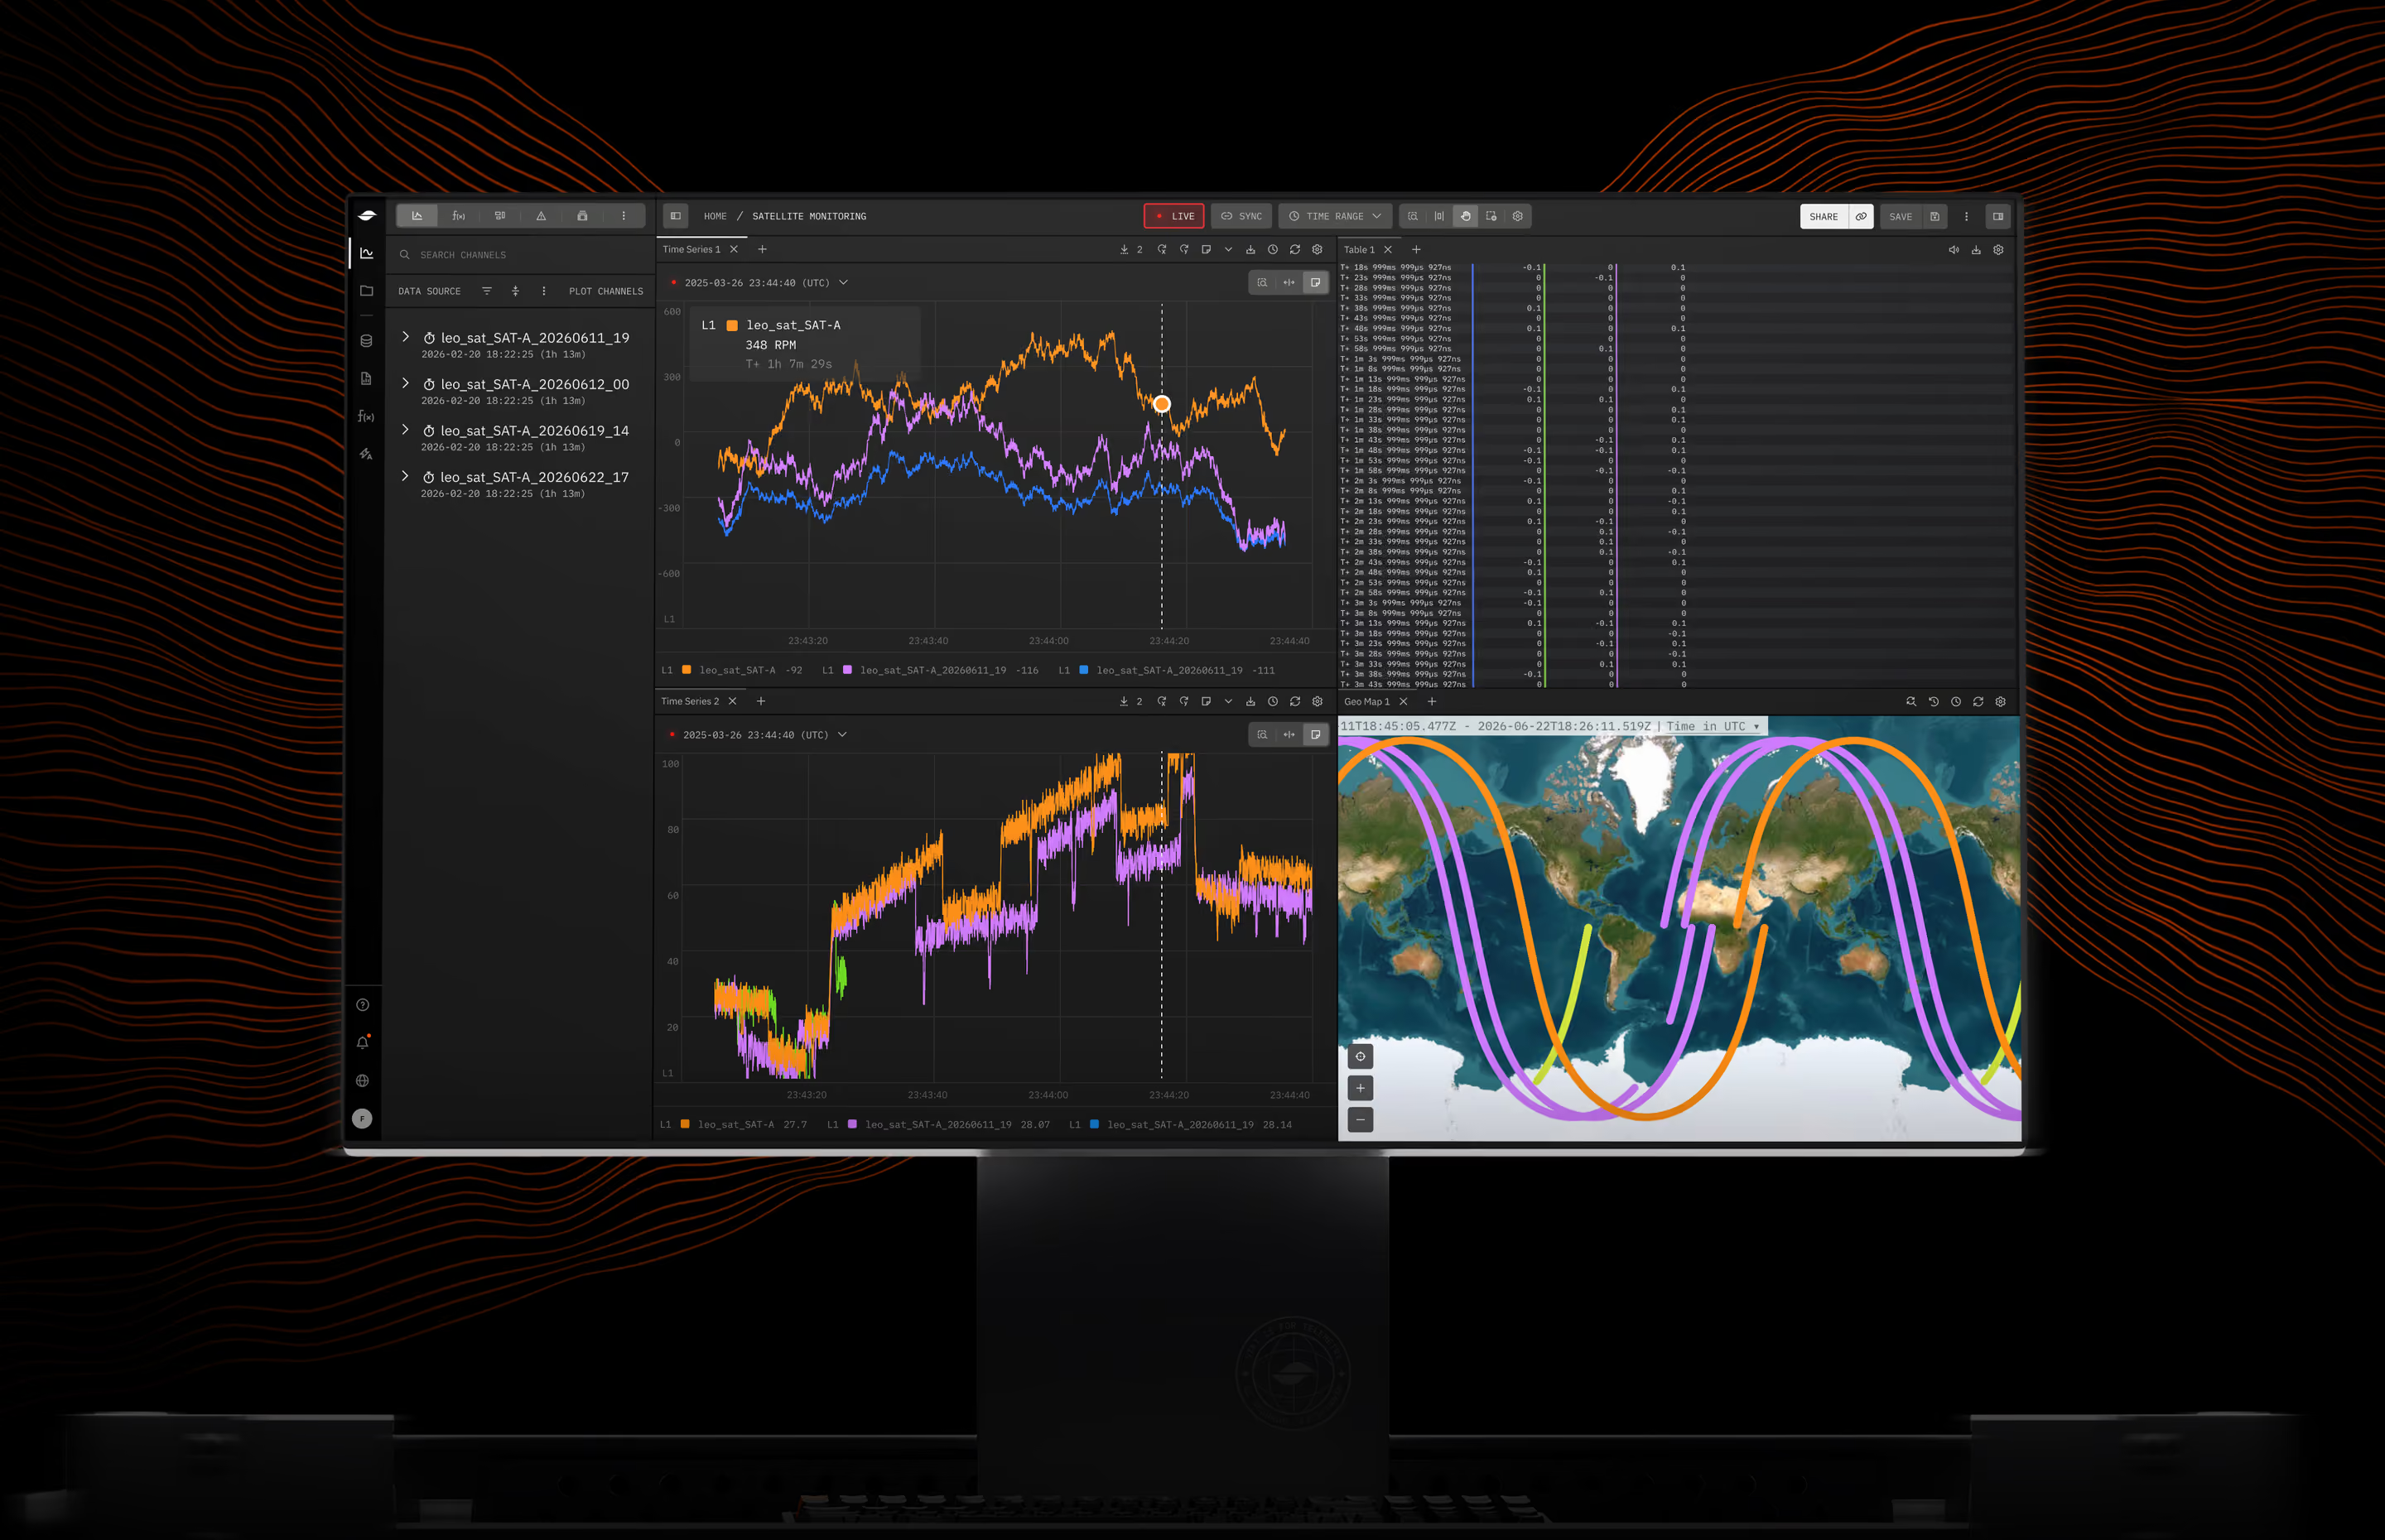

Plot any channel, compare any run, and build new signals inline. Time series, video, logs, maps, and tables sit side by side in one workspace, on live tests or historical runs.






Sync & live

Sync & live
Hover a spike in a pressure channel and the same instant highlights in the log table, on the map, and in the video frame. Zoom one panel and the synced panels follow.
Live mode streams telemetry at a refresh rate you set, so one workspace serves the test and the debrief.
The synced panels and the annotation lanes follow the zoom, so the detail arrives with the events around it.
Run comparison
Pick ignition, touchdown, a control cycle, or any annotation you have defined, and watch every run snap into alignment. Align by absolute time, relative time, a telemetry event, or a timestamp you set.
Families carry sigma statistics and dynamic thresholds, so a new run shows immediately where it sits against the band your previous runs established.
Dynamic Windows sets stat-channel ranges across every run in the family in one pass.
Anyone who opens your share link sees the runs aligned the same way you left them.
Calculated channels
Use rolling averages, ratios, or any expression you can write. Save it as a draft while you work, or publish it to the asset so every future run carries the same calculation automatically.
Drag across a time range for min, max, and mean on every channel in it. Freeze one selection to hold it beside another and read two windows side by side.
Metrics and time-series data export to CSV.
Annotations
Annotation lanes sit inside the time-series panel, in separate rows for phase markers and review findings. Phase annotations mark events like ignition, stage separation, or touchdown. Review annotations carry the finding an engineer recorded against a specific time range.
Show only the annotations that touch the channels currently on screen.
Hazard zones shade the ranges where telemetry stopped arriving, so a flat line reads as a gap in coverage.
Sharing
Every panel, the layout, the data selections, the compare settings, the calculated channels, the sidebar state, and the focused time all travel in the link. Six months later, the next engineer investigating the same subsystem opens it and sees the panels, the range, and the calculation you used.
Save a panel configuration once and reapply it to any run. Anyone on the team can apply it too.
Explore links build from a URL with runs, channels, and a time range, so a CI pipeline, an alert, or an on-call runbook opens straight into the plotted view.
Saved Explorations hold a setup across sessions.
Performance at scale
Telemetry keeps one form from storage through Apache Arrow into the browser and on to the renderer. Sixty-four-bit integers stay 64-bit integers, so two readings a fraction of a nanosecond apart stay two points on screen. Decoding and transforming run on separate threads, so the view keeps responding while telemetry streams in.
It stays visible on the panel, and full resolution is one zoom away.
Loaded telemetry caches in the browser, so a refresh or a dropped connection keeps your place in the run.
One workspace
Add the panel that answers your question, drag it where you want it, split the pane in any direction, or open one panel full-window in Spotlight.
Time Series
Time Series
Table
Scatter
Histogram
FFT
Geo Map
Metrics
Video Streaming
Stat Panel
Enum
Sift features
Write rules in the language your team already uses.
Mark up signals and events inline and assign follow-up, so context travels with the data.
Generate a shareable URL that sends your same view and data to a coworker
Aggregate results against requirements and generate audit-ready reports in one click.
Grant access to telemetry by attribute, so the right people see the right data.
Every anomaly arrives with the evidence already attached.
Customer achievements
“I had a test that passed and a test that failed, the same test run two different times. I put the two runs synced up on top of each other so I could step through the telemetry and see when they started diverging and why.”

Read the case study
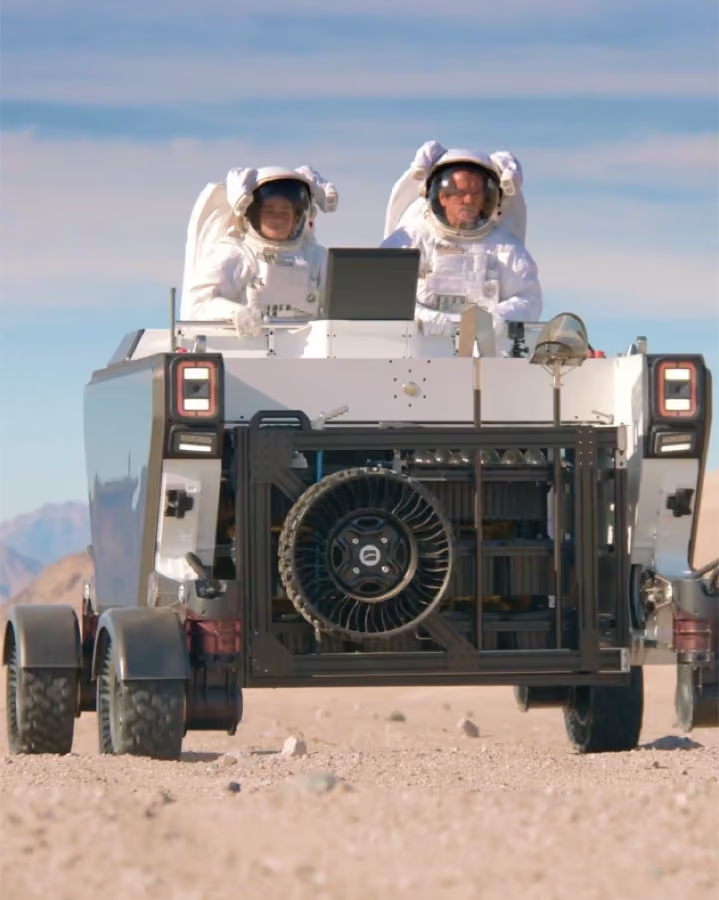
“Sift spared us from heavy internal tool investment and unified our data management. It provides a complete stack that’s intuitively accessible, plus we get an advanced, supportive team behind it, so it really wasn’t a question for us.”

Read the case study
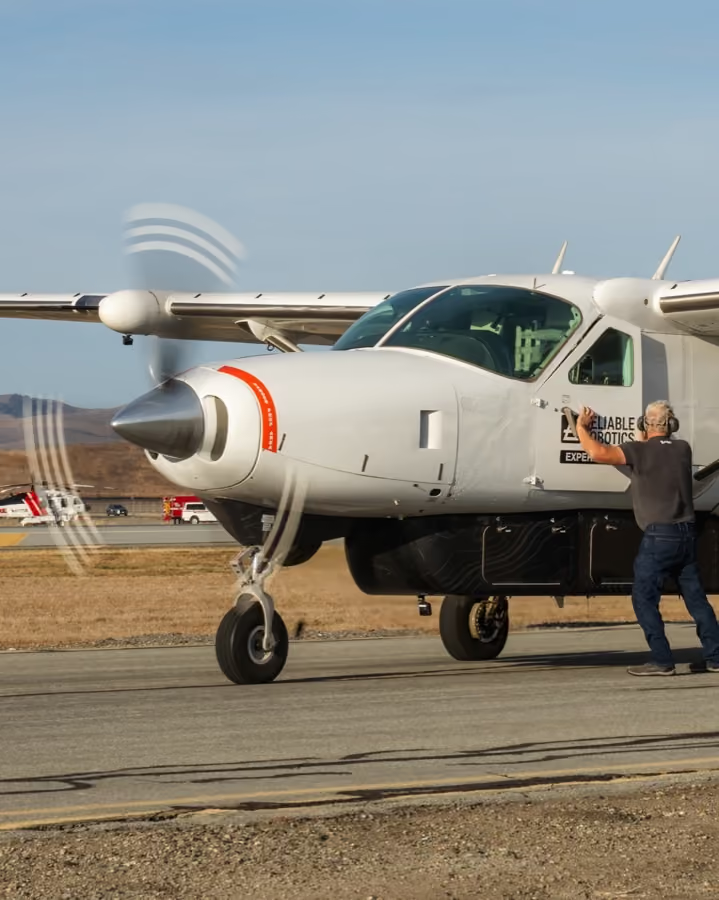
Root-cause investigations close with the evidence regulators need already in the workspace.

Read the case study
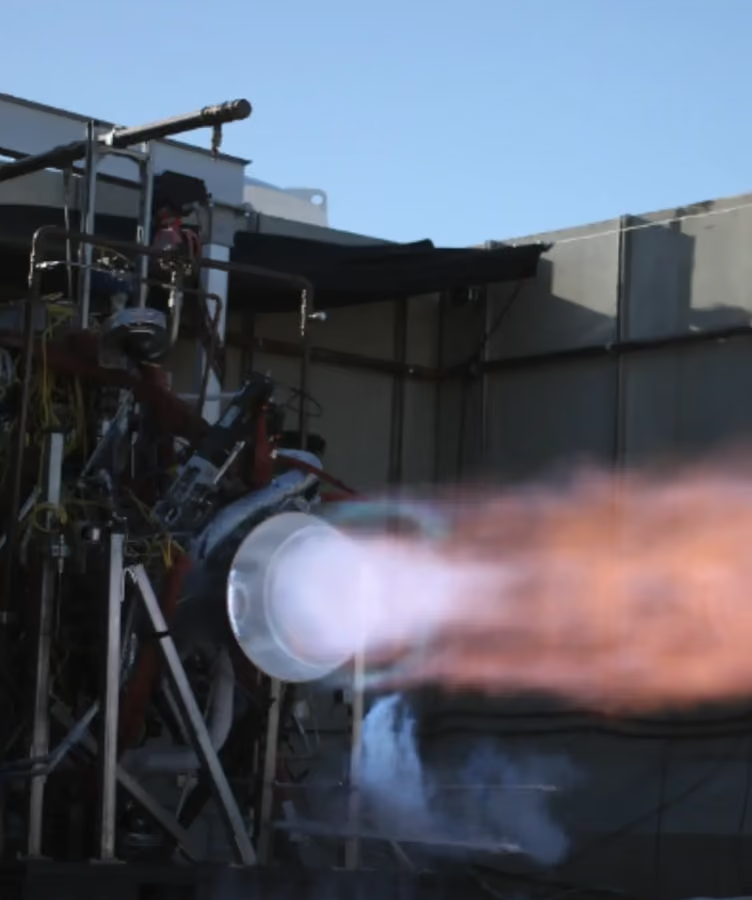
“We have a flow meter with a totalizer. I wanted to subtract out the beginning-of-the-day amount to see exactly what we used that day. Being able to just quickly throw in that initial number, everything was normalized to what I wanted to look at.”

“I had a test that passed and a test that failed, the same test run two different times. I put the two runs synced up on top of each other so I could step through the telemetry and see when they started diverging and why.”
Alex Maynard: Sr. Software Engineer
Read the case studyBring a sample from a real test to a 30-minute working session. Our engineers plot your CSV, ULOG, or TDMS files live and show you what Explore does on an actual investigation.