One layer ingests, stores, and evaluates telemetry for every product your team touches. Built for hardware programs where a single machine produces tens of thousands of separate measurements, called channels. K2 Space generates 20M+ points per second, and every one lands in Sift.
searchable in under a second across Parallel Systems' library.
generated by K2 Space's hardware on the test stand.
streamed live and queryable in minutes.






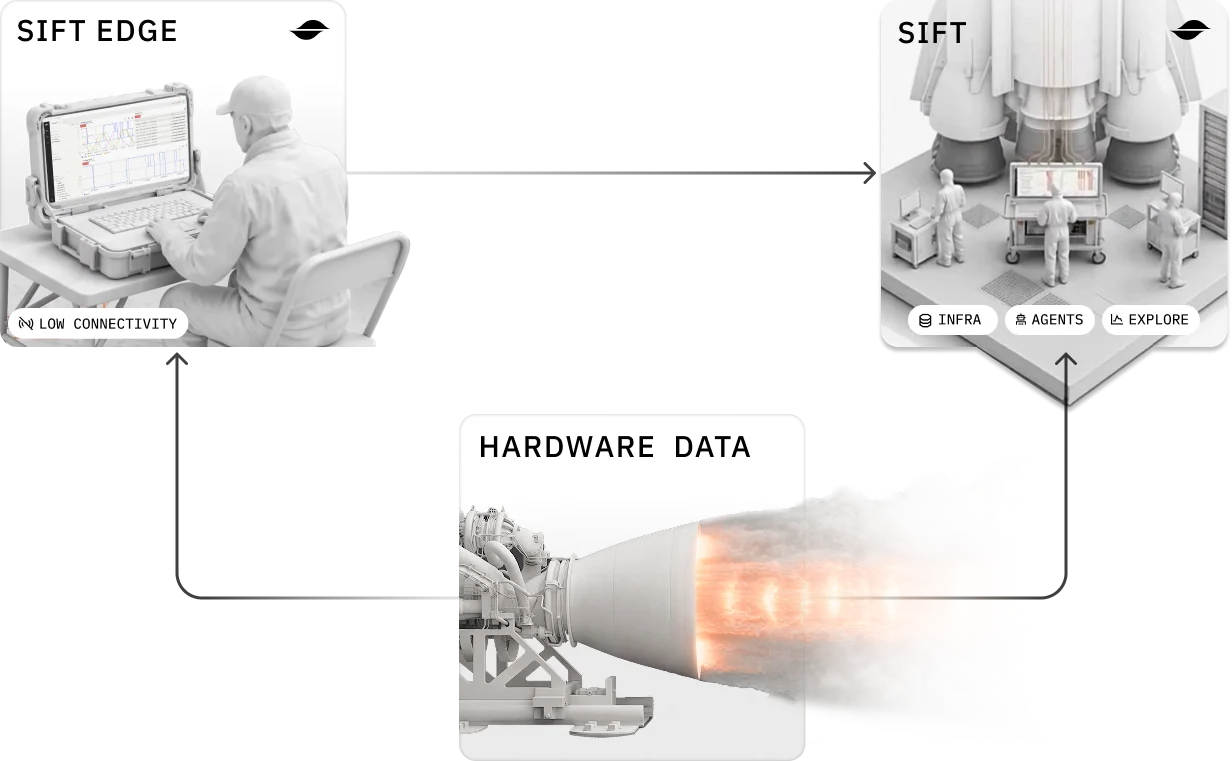
Telemetry lands once and serves every job your team does with it. One path in, one place it lives, one way to ask questions of all of it.
Three things strain a general-purpose time-series stack on their own: how fast telemetry arrives, how many separate channels it arrives on, and how often the shape of it changes. Hardware programs hit all three at once, on every firmware release. One data store answers all three together.
The demand
Where a general-purpose stack strains
How Sift answers
Read while you write
One CPU serves both writes and reads, and holding the index in memory makes usage climb during heavy ingestion or replay. Adding RAM works until the hardware is fixed, as it is on-prem.
Separate paths for live and historical telemetry, with 99 of every 100 writes landing in the hundreds of milliseconds
Grow the channel count
A single global index means the database traverses every unique key in the org to answer one query, so the slowest queries keep getting slower as sensors multiply
Indexing that scopes to one asset before matching channel names, holding sub-second search at roughly 200 million channels
Change what you measure
Every change to the shape of the telemetry generates thousands of new index entries, which compounds the channel-count problem and forces a choice between moving fast and staying stable
New telemetry lands inside the same model of assets, channels, and runs your team already works in, so current and historical runs stay comparable on one time axis
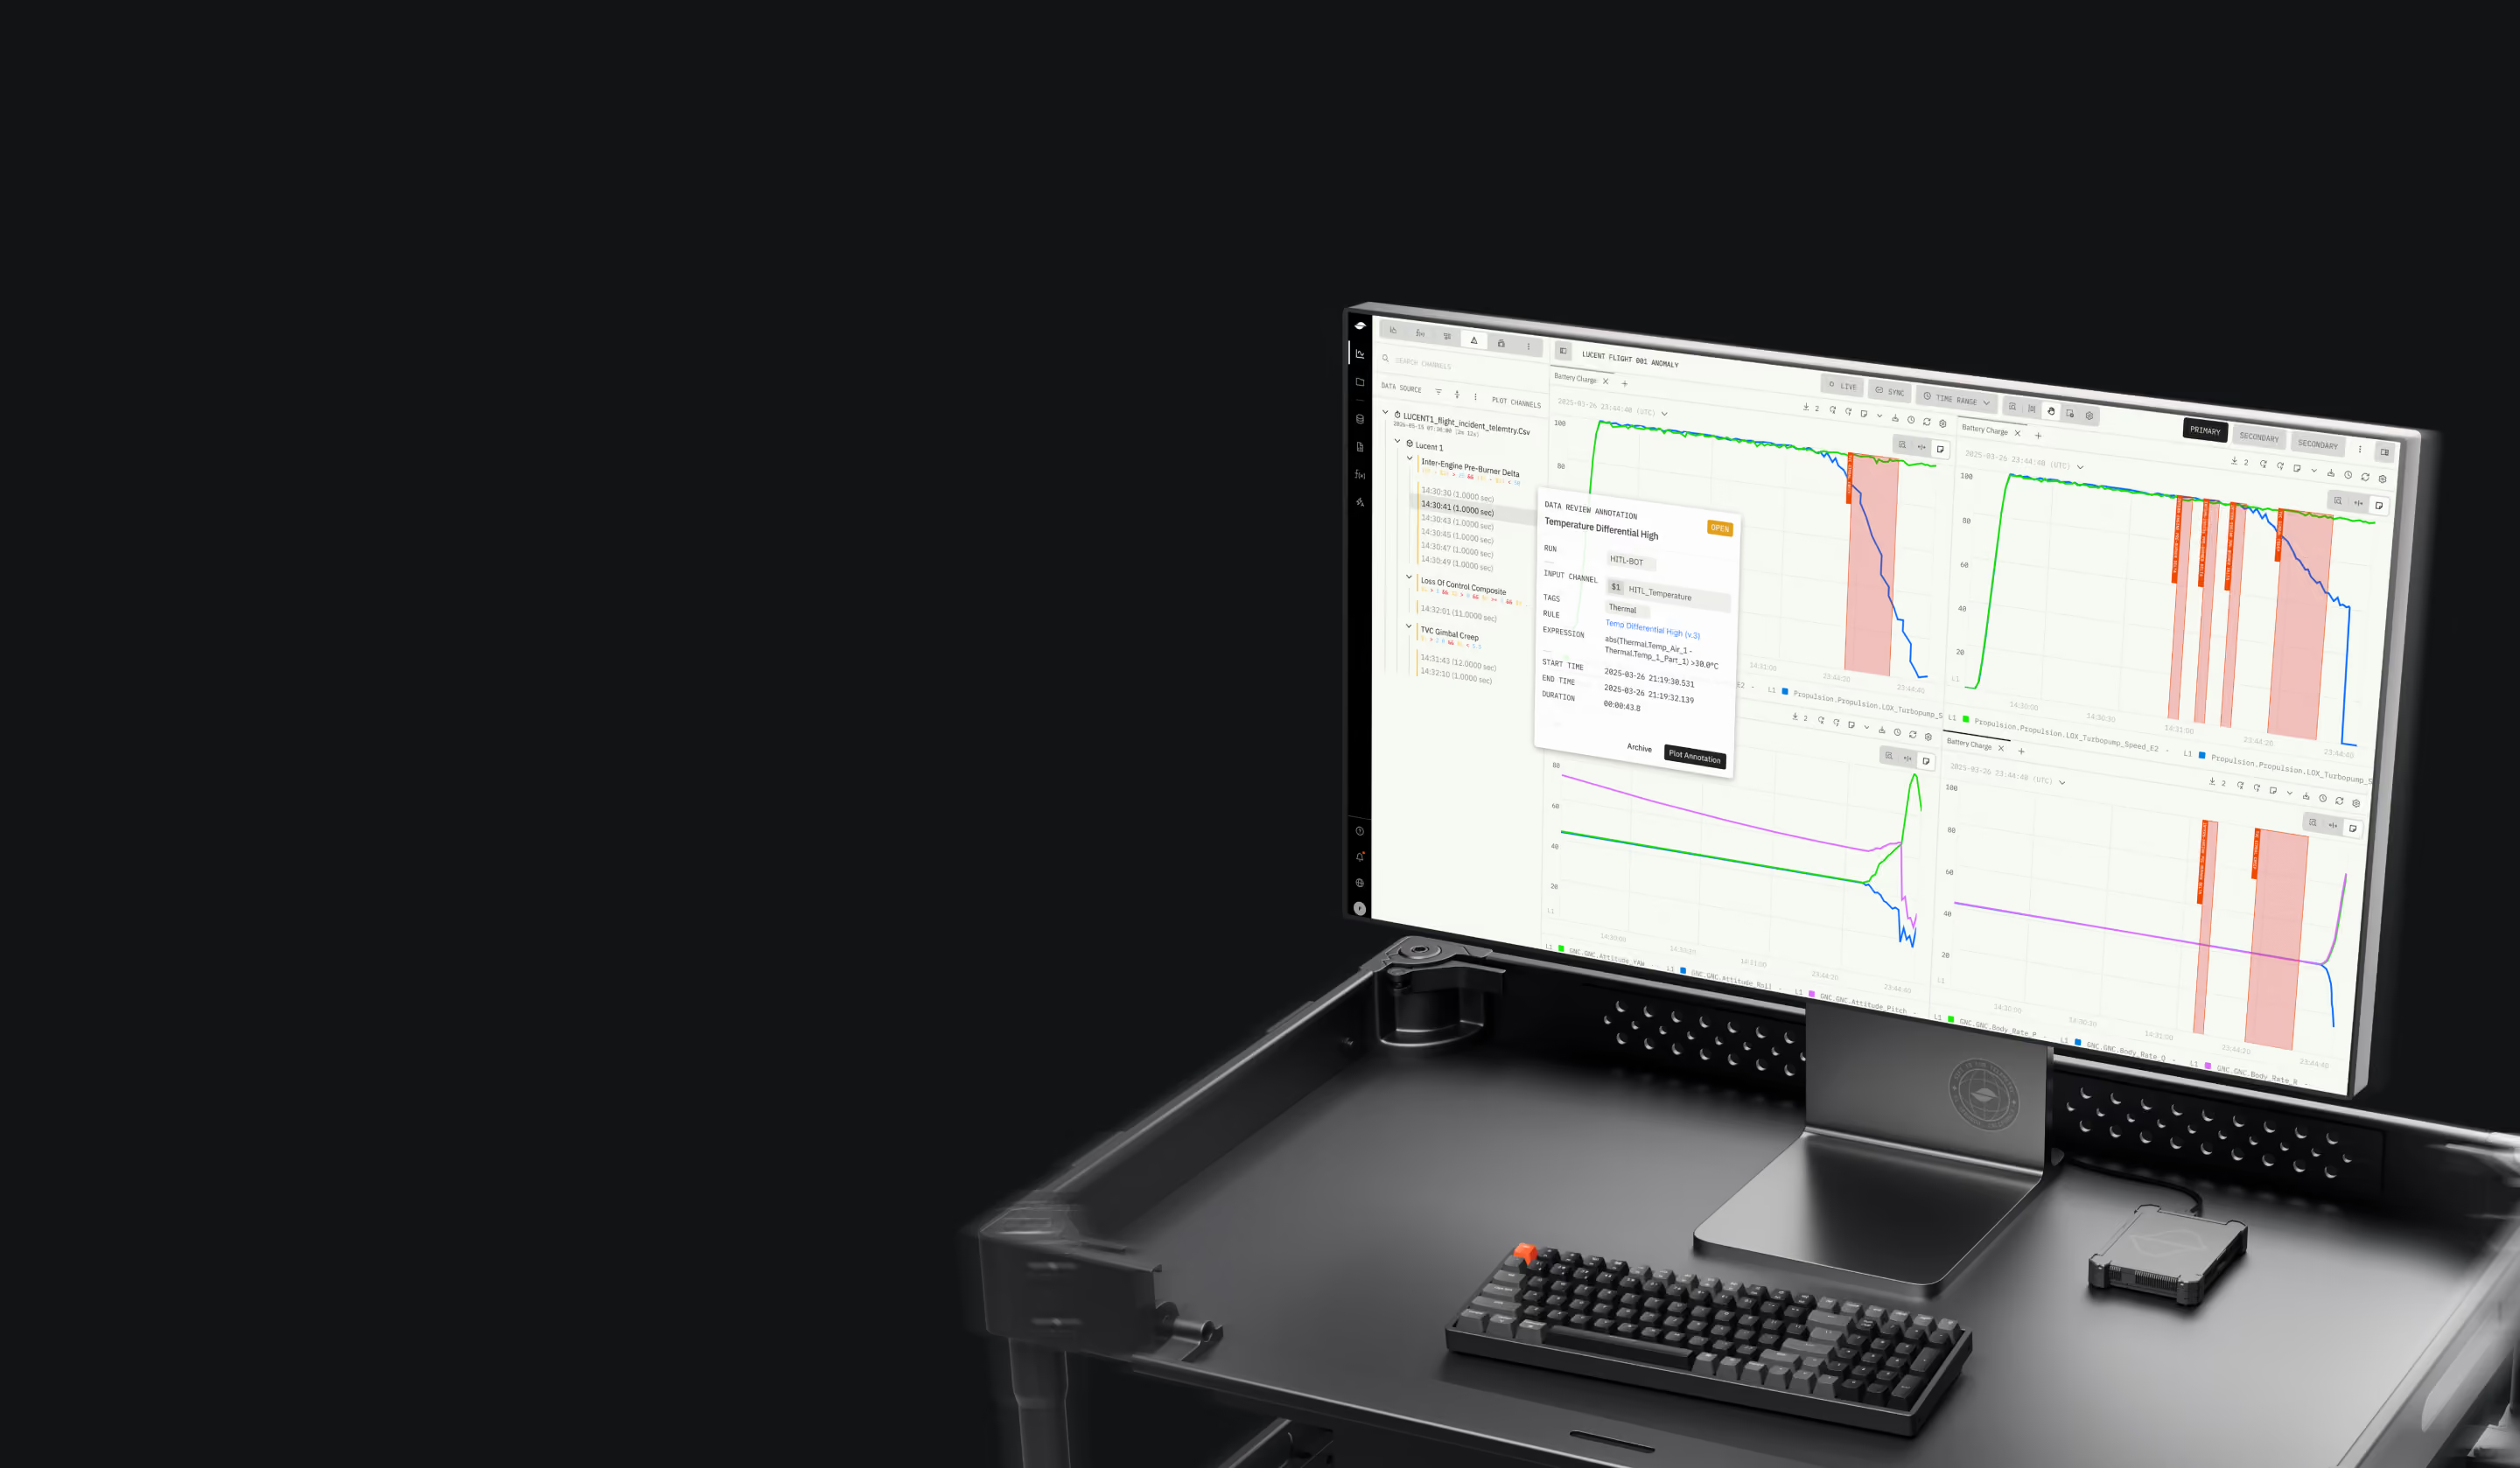
Telemetry gets evaluated as it arrives, against rules your engineers write. Anomaly detection, filtering, and new signals calculated from existing ones all compute on the way in. The moment a limit is breached or resolved, the flag lands while the hardware is still on the stand.
Sensor streams, logs, and video arrive from test stands, flight systems, and CI pipelines through one path.
Rules track behavior across time, so slow drift and rate-of-change violations surface alongside a straight limit breach.
Attach a webhook to a rule and the notification reaches Slack, PagerDuty, Jira, or OpsGenie with the rule name, status, and asset name carried into the message.
Historical telemetry lives in Parquet, an open columnar format, which keeps storage and processing power independent so each one scales on its own curve. Object storage carries the channel counts hardware produces, at volumes where a single asset can hold tens of thousands of distinct sensors, that keep cost predictable as the fleet grows. Live streams run through a purpose-built cache that keeps serving through two simultaneous failures, so performance holds when hundreds of people open the same link during a launch.
Capacity grows with the fleet, and each side scales to exactly what the workload asks for.
Historical runs come back in minutes or less, so a question about last quarter's campaign gets an answer in the same sitting.
Export to CSV, Parquet, and Sun (WinPlot), split by asset or run, or pull programmatically through REST and the client libraries. A documented path carries telemetry into MATLAB.
Type the fragments you remember. Searching gnc imu reaches gnc.flight_computer1.imu3, and every other inertial measurement unit on the vehicle, from partial input. Descriptive tags are searchable too, so a thermal engineer reviewing a vibration test can query by subsystem, units, or test type and reach channels from anywhere in the program.
Parallel Systems holds roughly 200 million channels across its library, with almost 45,000 sensors on its densest single asset alone. Search stays sub-second across all of it.
Query by asset, subsystem, units, data type, signal type, or engineering tag.
Filtering by asset ahead of pattern-matching keeps every team's searches fast as sensor counts grow.
Capabilities stay identical across every deployment model. Run it as managed software, hybrid with processing on your own hardware and storage in the cloud, inside your own private cloud, or fully on your premises for classified operations, including networks kept physically disconnected from the internet. GovCloud is live for federal programs.
FedRAMP High through partnership with Knox Systems. SOC 2 Type II. Compliant with ITAR, CMMC2, and NIST SP 800-171.
One customer's on-premises deployment removed a cloud round trip their prior architecture required, and kept telemetry flowing through power and network interruptions during thermal vacuum (TVAC) testing.
REST and gRPC generate from the same Protocol Buffers definitions, with official clients for Python, Rust, and Go and a CLI for the terminal. One customer builds custom mission-control and review tools on top of Sift inside their air-gapped environment.
The Grafana plugin adds Sift as a standard data source alongside anything else in the same dashboard.
.svg)
.svg)

Sift [is] critical in making operations seamless, automatically flagging out-of-bounds telemetry, and helping us close the design loop by using real-world data to improve.